How to debug an AngularJS app in Visual Studio Code with Chrome
I've been using Visual Studio Code quite a bit recently as a project I'm working on is written in AngularJS, with gulp based build scripts. As this is part of my first real foray into using tech that's outside of the "core" Microsoft stack, it's been quite the learning exercise which I've blogged about some of here:
- How to debug gulp tasks in Visual Studio Code - Gulp 4
- Gulp, Node.js and "require.extensions.hasOwnProperty is not a function"
- AngularJS, HTML 5 Mode, IIS (Express) and hitting F5/Refresh - Setting up URL Rewrite via the IIS Manager UI
- AngularJS, HTML 5 Mode, IIS (Express) and hitting F5/Refresh
One of the things I've been missing, until now, is the ability to debug the AngularJS code for the application, inside of Visual Studio code so that I've got a more "full on" development experience. Debugging in browser based Developer Tools has its place, but even as good as they are now it's not quite the same as working in an IDE.
Setting up Visual Studio Code to debug in Chrome
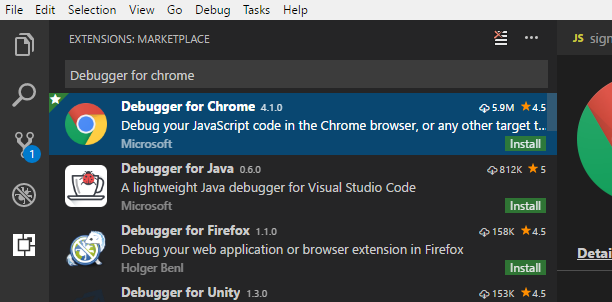
The first thing to do is to download the Debugger for Chrome Visual Studio Code extension. The easiest way to do this is to go to the Extensions view in Visual Studio code (View > Extensions or CTRL-SHIFT-X), search for the extension and then click the "Install" button:
Once it's installed it's a simple matter to add an entry to .vscode/launch.json, creating the file if it doesn't already exist that tells Visual Studio Code what to do. This is the same file that is involved when I setup Visual Studio Code to debug my gulp scripts and the content in launch.json for me (just for the Chrome debugging) looks like this:
{
    "version": "0.2.0",
    "configurations": [
        {
            "type": "chrome",
            "request": "launch",
            "name": "Launch Chrome against localhost",
            "url": "http://169.254.80.80:3003",
            "webRoot": "${workspaceFolder}/.dev/"
        }
    ]
}
The two key lines in the configuration block that needed customisation are url and webRoot. They should be fairly self explanatory, but just to break it out:
url: This is the starting page for your application, or more precisely, the page you want to start on
webRoot: This is the folder where the web server you're using (in my case one triggered by the gulp script) is serving its content from. If you don't get this right, breakpoints won't be hit. In fact, they'll show up as a faded red dot rather than a solid red dot to indicate you've not got the mapping right. There's a brief description of ${workspaceFolder} in the Variable substitution part of the Debugging in Visual Studio code docs.
In my case, I've pointed Visual Studio Code at the .dev folder underneath my project root as this is where my gulp scripts deposit everything after they've processed it all. The only risk/problem with doing this is that you could end up modifying files there (which are compiled derivatives of your source code) rather than your actual source files, something to be aware of. If your source files are largely un-changed, you're probably better off pointing it at the "true" source to avoid falling into this pit.
Running the debugger
The first thing to do is to make sure that you've got your web server started and content being served, next is to load the Debug view. Do this by pressing CTRL-SHIFT-D or choosing View > Debug from the menu:
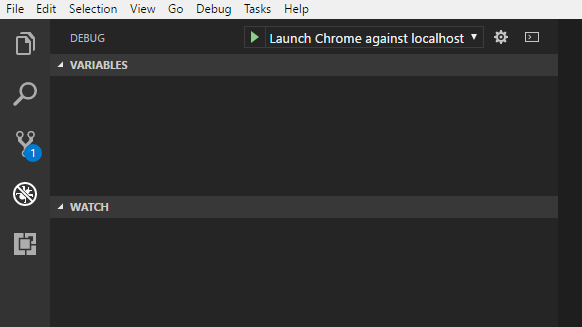
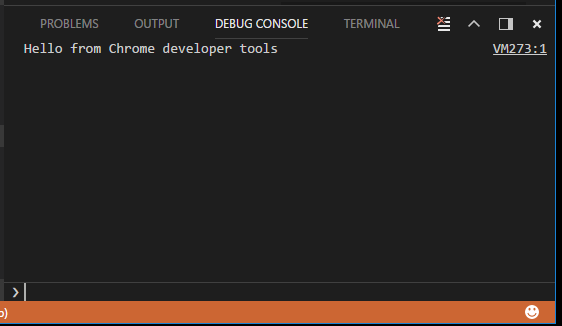
Make sure that Launch Chrome against localhost is selected in the drop-down next to the play button, then click play. This should cause Chrome to open and navigate to the page you specified. One way to see the debugger integration in action is to open Chrome Developer Tools and type:
console.log('Hello from Chrome developer tools')
You can then look at the Debug Console pane in Visual Studio Code, which should already be visible (if it's not, CTRL-SHIFT-Y or View > Debug Console in the menu) and see the message echoed there:
Setting and hitting a breakpoint
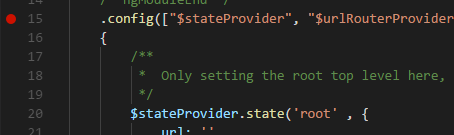
After all that, setting a breakpoint so that you can debug in Visual Studio Code is almost an after-thought. I've done this by setting one in the startup code for my application which is in app.js:
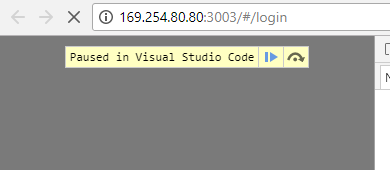
After that it's just a matter of pressing F5 in Chrome which causes Chrome to pause and display this:
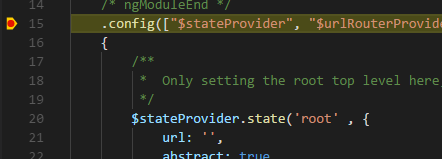
And Visual Studio Code to break into the code:
The Debug view in Visual Studio Code is now showing variables (global and local), watches that I've set, the current call stack, breakpoints that have been set - in short, all the things you'd expect to see when you're debugging.
There's pretty detailed documentation for the Debugger for Chrome extension on its Visual Studio Marketplace page that I used to help me get this running. If there's anything that doesn't seem to work quite right for you, it's worth taking a look there!