Setting up OpServer, the awesome monitoring solution from Stack Exchange

Monitoring. You know it's important, I know it's important, Everyone knows it's important, but,... it's often not given the focus that it so justly deserves.
If you're in a position where you don't have any monitoring in place, getting some monitoring in place quickly so that you've got something is eminently sensible. You at least have breathing room to start making a considered decision about what you're going to do.
You wouldn't go far wrong by choosing Opserver from Stack Exchange as your something. It's pretty damn good and there's probably a good case for getting it in place and then building the rest of your monitoring solution around it.
The steps I took to put it in place are:
- Download the source from GitHub (I used the master branch here)
- Compile the source (I used Visual Studio 2017 for this)
- Publish to an IIS server
- Edit the configuration files
Setting it up
Most of this is covered briefly in the documentation, but the key thing here is to look in the Config folder under the Opserver projcet. This contains a selection of files that end in '.example.json' that give examples of the configuration you can setup and the structure of each file. The one key exception to the '.example.json' rule is that the security settings file, which is the first one you really need, is XML so ends in '.example.config'. I opted for this:
<SecuritySettings provider="alladmin" />
Which pretty much strips away all security by letting anyone log in. It doesn't matter what credentials you enter (I just logged in with the user [email protected], for example) you'll be allowed in and given admin rights. To get started, that's horribly insecure, enough for now.
Depending on what you've got in your environment you can setup monitoring for various different things, I've started by setting up:
- SQL Server monitoring
- Redis monitoring
- Application logging monitoring (by using StackExchange.Exceptional)
- Server monitoring
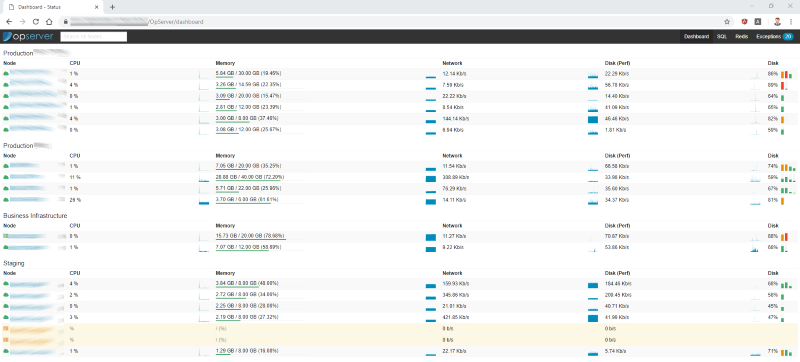
The monitoring that's shown in the screenshot is the Dashboard, configured in the DashboardSettings.json file. For me, that's been setup by using WMI and filling in the list of nodes which have then been grouped into categories by setting patterns for each category. This does require the IIS application pool that hosts OpServer to be running with an identity that has rights to perform WMI queries against the machines listed.
The penultimate one there, application logging monitoring, is possibly the most epic of the lot. By using StackExchange.Exceptional to capture exceptions logged by our applications I can have a live dashboard of issues, rather than looking at log files retrospectively. It does a couple of particularly awesome things that make the reporting much more usable:
- Issue aggregation - if the same exception is logged repeatedly it gets totalled in a Count column, rather than there being line after line for it
- Instant stack trace access - clicking through to an exception gives a full stack trace, along with other useful information. In the case of a web application this is server varriables, query parameters and request headers. Awesome!
A signficant chunk of January is going to be spent getting this productised, particularly around weaving StackExchange.Exceptional into the codebase. Being aware of an issue before a user has had a change to report it, and thus potentially being able to give them a solution the moment they do, is a fantastic place to be in and really turns system monitoring up a notch!