Using MiniProfiler with a hybrid asp.net Web Forms / MVC application - Part 2
Part 1 covered creating a hybrid ASP.NET WebForms / MVC project, adding MiniProfiler to the project, showing MiniProfiler output on the WebForms page and adding an event to the MiniProfiler output. In this part I'll show how to make an AJAX call to a controller action and instrument the action so that the activities that take place in it show up in the MiniProfiler output (this is the easy bit!).
The code for this solution can be found on GitHub at https://github.com/robertwray/BlogStuff in the MiniProfilerWithWebFormsAndMvc project.
Create and instrument a controller
To show this off, I created a controller called JavaScriptController (which will respond to requests to URLs like /Javascript/XXXXXXXX) containing two actions, one that has server-side profiling in it and one that doesn't. The one that has no server-side profiling is to "show-off" the fact that MiniProfiler will capture the time taken by jQuery AJAX requests, irrespective of whether there's any server-side profiling taking place.
The controller consists of:
public class JavascriptController : Controller
{
    public MiniProfiler Profiler
    {
        get
        {
            return MiniProfiler.Current;
        }
    }

    public ActionResult GetDataProfiledServerSide(int howLongShouldIWait = 200)
    {
        using (Profiler.Step(nameof(GetDataProfiledServerSide)))
        {
            var data = new { Item1 = "Hello", Item2 = "World!", Item3 = 123 };

            using (Profiler.Step("Long Running Operation"))
            {
                // Simulate a "slow" request
                System.Threading.Thread.Sleep(howLongShouldIWait <= 0 ? 200 : howLongShouldIWait);
            }

            AnotherMethodThatDoesStuff();

            return Json(data, JsonRequestBehavior.AllowGet);
        }
    }

    public ActionResult GetDataWithoutServerSideProfiling(int howLongShouldIWait = 200)
    {
        var data = new { Item1 = "Hello", Item2 = "World!", Item3 = 123 };

        // Simulate a "slow" request
        System.Threading.Thread.Sleep(howLongShouldIWait <= 0 ? 200 : howLongShouldIWait);

        return Json(data, JsonRequestBehavior.AllowGet);
    }

    private void AnotherMethodThatDoesStuff()
    {
        using (Profiler.Step(nameof(AnotherMethodThatDoesStuff)))
        {
            System.Threading.Thread.Sleep(50);
        }
    }
}
And the addition to the markup is a small smattering of Javascript, rather lazily dropped into Site.Master:
<script type="text/javascript">
    $(document).ready(goAndGetData);

    function goAndGetData()
    {
        $.ajax(
            {
                url: '/Javascript/GetDataWithoutServerSideProfiling'
            }).done(function (data)
            {
                $.ajax(
                    {
                        url: '/Javascript/GetDataProfiledServerSide'
                    }).done(function (data)
                    {
                        alert('Data has been received, you should be able to see this having happened in MiniProfiler (server AND client side)');
                    });
            });
    }
</script>
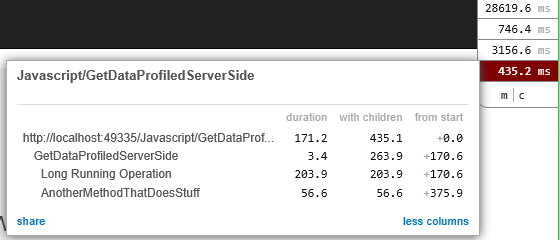
With that code added, hitting F5 and starting the project will load the page and show a bit more information in the MiniProfiler window:
Automatically instrumenting Controller actions
There is a built-in (to MiniProfiler.Mvc) way to instrument calls to controller methods, and that's to use the ProfilingActionFilter from the StackExchange.Profiling.Mvc namespace by adding it to your GlobalFilterCollection. This is usally done by having a class called FilterConfig in the App_Start folder (which may already be present in your project), which will basically look like this:
public class FilterConfig
{
    public static void RegisterGlobalFilters(GlobalFilterCollection filters)
    {
        filters.Add(new ProfilingActionFilter());
    }
}
And then having a call to
FilterConfig.RegisterGlobalFilters(GlobalFilters.Filters);
in the Application_Start method of Global.asax. Once this is in place, every call to a controller action will automatically add to the output in MiniProfiler:
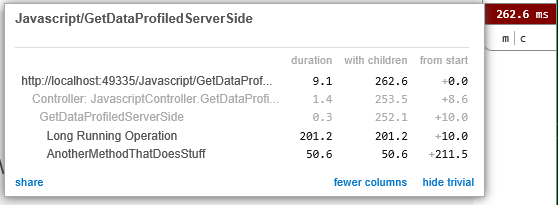
This screen-grab also shows off the "show trivial"/"hide trivial" link that you can click on if some of the logged actions took such a short amount of time, that they don't warrant showing by default. By doing this, MiniProfiler gets the "noise" out of the way and you only see the parts of the profiled operation that are taking the time.